

Americans work longer hours than many other developed economies. According to OECD data, the average US employee works about 1,790 hours per year, compared to roughly 1,716 hours across the OECD. The difference becomes more pronounced when compared with countries that place stronger structural emphasis on work life balance. Employees in Germany and Denmark, for example, average closer to 1,400-1,450 hours per year.
Furthermore, longer working hours can lead to broader declines in employee wellbeing. Gallup’s 2025 State of the Global Workplace report shows that only 33% of employees globally are thriving in their lives, while global employee engagement has fallen to 21%. Gallup consistently finds that employees who are not engaged are more likely to experience daily stress and negative emotions. Job design, workload, and limited flexibility do play a significant role in shaping day to day experience at work.
At Elevate Leadership, we continuously examine how these structural conditions play out at every level. To better understand how work-life balance looks across the U.S. today, we analyzed thousands of data points across the 100 most populous cities in the U.S. Metrics included hours worked, commute patterns, labor force participation, housing affordability, and access to recreation and entertainment. We then compared these metrics to the last time we ran this study in 2024.
The results formed our 2026 Best Cities for Work-Life Balance ranking. Read on to see how each city compared.
The 10 Cities With the Best Work-Life Balance
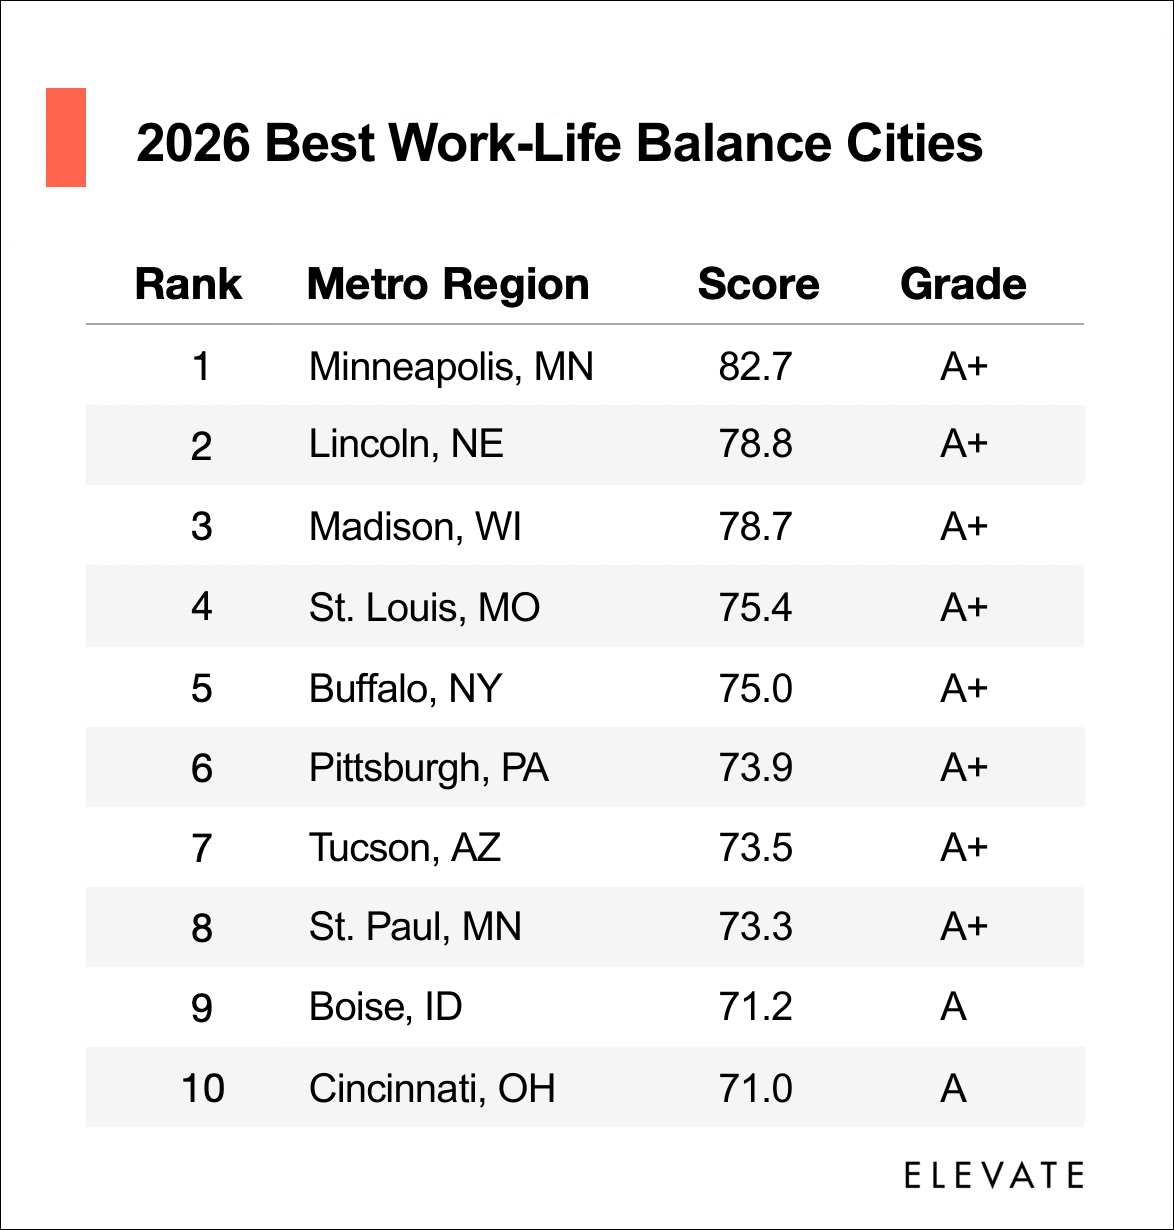
1. Minneapolis, MN
Minneapolis topped our list as the best work-life balance city for 2026. It’s a strong performer across multiple categories, including average hours worked per week at 36.6, labor force participation at 85.9%, and average commute time. Minneapolis also ranked well for bike friendliness and access to recreation.
These rankings align with its success across other Elevate data studies. Minneapolis also placed first across both the Best Cities for a Career Change in 2025 and Best Cities for Working Women in 2025, reinforcing its reputation as a place where professional growth and quality of life intersect.
2. Lincoln, NE
Lincoln placed second, reflecting consistent performance across core work-life balance metrics. The city has a strong labor force participation rate of 85.3%, average commute times of just 19.2 minutes, and affordable housing costs relative to median income.
3. Madison, WI
Despite dropping two spots from our 2024 study, Madison remains an amazing work-life balance city. The city scores well across nearly every metric in our report, including the highest labor force participation rate of any city at 87.6%, the third lowest average hours worked per week at 36.3, and a top 15 ranking for shortest commute times with an average travel time of 20.7 minutes. Madison also ranked seventh in our Best Cities for a Career Change in 2025 study, highlighting its continued appeal for professionals seeking balance alongside long term career flexibility.
4. St. Louis, MO
St. Louis is the fourth best city for those looking for work-life balance in 2026. It’s supported by strong affordability and manageable commute times. Housing costs accounted for 32.9% of median income, while average commute times were 23.6 minutes. It also ranked ninth on our list for the Best Cities for Working Families in 2025.
5. Buffalo, NY
Looking for better work-life balance in the Northeast? Buffalo holds steady in fifth place in both 2024 and 2026. The city has the second fewest hours worked per week of any city at 36.2, and ranks in the top 20% of all cities for shortest commute time, housing affordability, walkability, and bikeability. The only dim spot was the city’s labor force participation at 75.1%.
6. Pittsburgh, PA
Pittsburgh comes in ranking sixth on our list. The city ranks high in entertainment and recreation options, placing in the top 20% of all cities we studied. It also has some of the fewest hours worked per week at 36.6, and comes in the top 25% of all cities for walkability.
7. Tucson, AZ
Tucson pairs its warm climate with strong performance on employee friendly metrics, ranking seventh overall for work-life balance. The city recorded the fourth lowest average hours worked per week of any city at 36.4 and also scored well for commute efficiency and bike friendliness. Combined with easy access to outdoor recreation, these factors support a lifestyle that prioritizes balance both during and outside of work.
8. St. Paul, MN
Though Minneapolis came in first in our study, St. Paul stands out in its own right for work-life balance. The city benefits from short commute times averaging 20.6 minutes, steady labor force participation at 80.8%, and relatively affordable housing costs relative to median income. Beyond the numbers, St. Paul offers extensive access to parks, trails, and cultural institutions, creating an environment where work fits more comfortably alongside everyday life.
9. Boise, ID
In ninth place, Boise performs well in commute related metrics, with only 3.7% of workers facing hour long commutes, and maintains solid labor force participation at 81.9%. While housing affordability has tightened relative to past years, Boise’s access to outdoor recreation and strong community infrastructure help sustain its reputation as a place where professional and personal priorities can coexist. Boise also ranked first in our Best Cities for Working Families in 2025 study, reinforcing its continued appeal for households balancing work and family demands.
10. Cincinnati, OH
Cincinnati rounds out our 2026 list with a combination of affordability and livability. The city benefits from steady labor force participation at 80.9% and a growing mix of cultural, dining, and riverfront amenities. Cincinnati is an increasingly attractive option for those seeking career advancement and balance without the pressures of a larger metro.
Methodology
To calculate our rankings, we created indices for a number of metrics relevant for work-life balance. See each specific source below:
Walk Index (5%) & Bike Index (5%)
To gauge both the walkability and bike friendliness of each city, Walkscore data was gathered in January 2026.
Housing Cost as Percentage of Income Index (20%)
This is the median housing cost as a percentage of total income for full-time workers. Data comes from the U.S. Census Bureau’s most recent ACS dataset (1 year American Community Survey).
Hours Worked Per Week Index (20%)
This is the average number of hours a worker in each city works in a week. Data comes from the U.S. Census Bureau’s most recent ACS dataset (1 year American Community Survey).
Labor Force Participation Index (10%)
This statistic is calculated by the total number of workers in the labor force who were unemployed, divided by the total labor force in each city. Data comes from the U.S. Census Bureau’s most recent ACS dataset (1 year American Community Survey).
Hour Commute Index (15%)
This is based on the percentage of workers with a commute longer than 60 minutes. Data comes from the U.S. Census Bureau’s most recent ACS dataset (1 year American Community Survey).
Commute Travel Time Index (10%)
This is based on the average number of minutes it takes for a worker to commute to work in each city. Data comes from the U.S. Census Bureau’s most recent ACS dataset (1 year American Community Survey).
Entertainment & Recreation Index (15%)
This index was derived from a number of different sources, including the U.S. Census, Tripadvisor, The Trust for Public Land, Numbeo, and Yelp.
- Total number of attractions in each city
- Restaurants per capita
- Total number of coffeeshops
- Hiking trails per capita
- Share of population with walkable park access
- Share of designated parkland areas
- Acres of parkland per capita
- Movie theaters per capita
- Public swimming pools per capita
- Tennis courts per capita
- Public beaches per capita
- Shopping centers per capita


