

Top 100 Happiest Cities in the U.S. in 2026
What makes a city a happy place to live? A steady job and affordable home certainly help. But happiness is also about how you feel day to day. It’s having time outside of work, feeling connected to other people, and living somewhere you feel safe.
Americans are struggling on some of these fronts. According to Gallup’s 2026 State of the Global Workplace report, only 51% of U.S. employees are thriving in their overall lives, down from 61% in 2017. The U.S. also ranks just 23rd out of 147 countries for life evaluation in the 2026 World Happiness Report.
At Elevate Leadership, we spend a lot of time thinking about what helps people thrive at work. But work is only part of the equation. Mental distress, loneliness, financial pressure, and the communities people return to at the end of the day matter too.
That’s why we analyzed the 100 most populous U.S. cities across measures of mental and social well-being, financial stability, and access to community and recreation. The results formed our ranking of the Top 100 Happiest Cities in the U.S. in 2026. Read on to see who made the cut!
Top 10 Happiest Cities in the U.S.
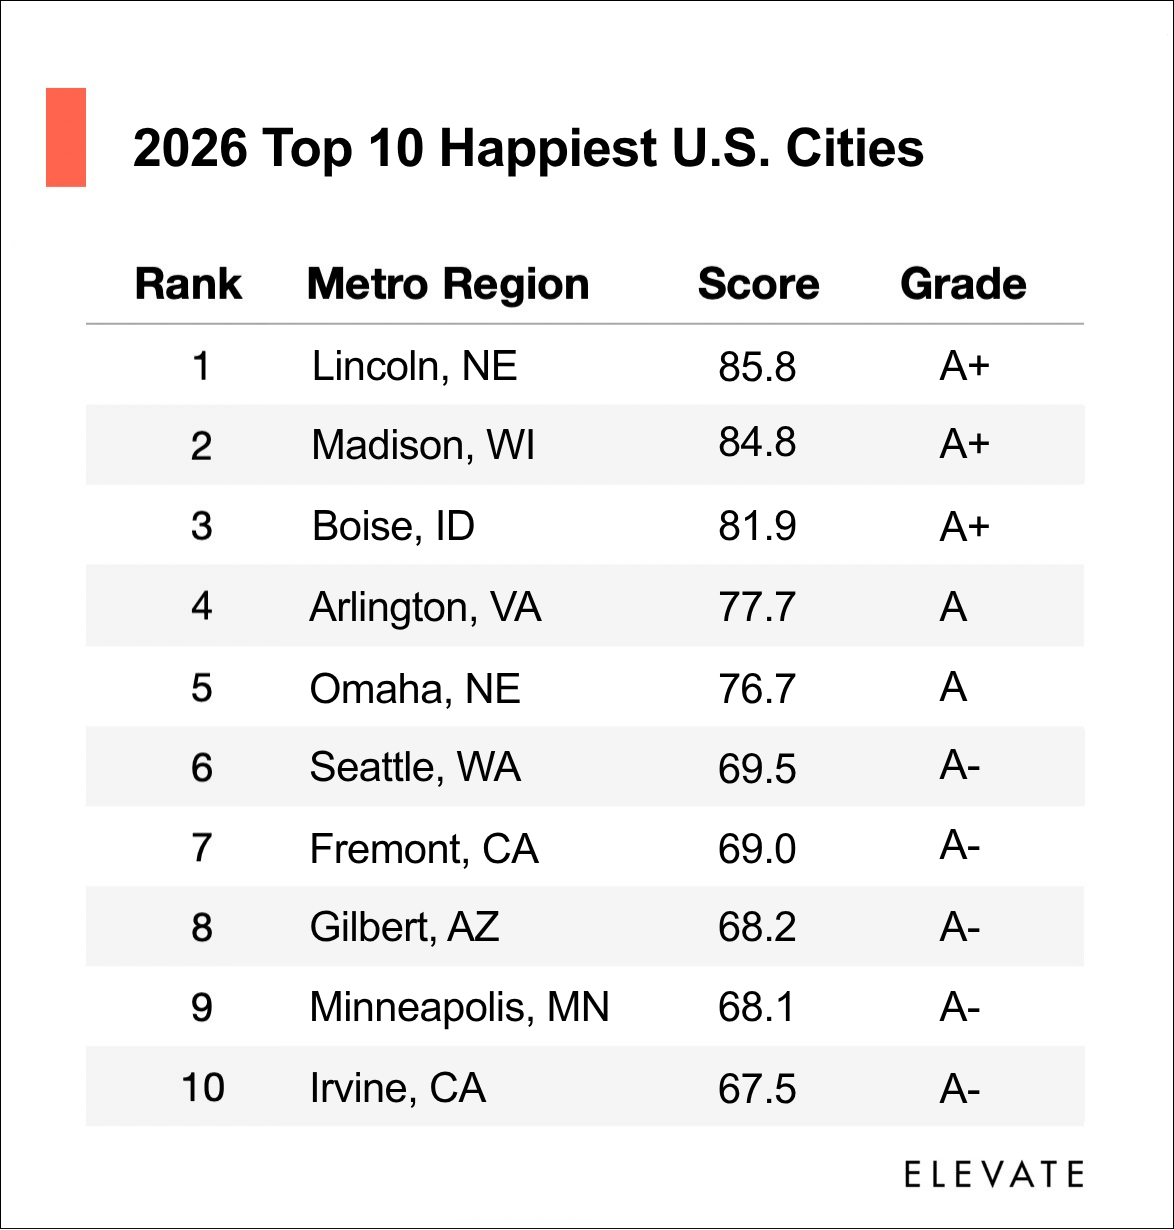
1. Lincoln, NE
Lincoln takes the number one spot as the happiest city in the U.S. this year. As Nebraska’s capital, the city combines college-town energy with short commutes and a relatively manageable pace of life. Residents work an average of just 35.7 hours per week, while unemployment sits at only 2.6%. Frequent mental distress is also relatively low at 14.9%. Lincoln’s strong showing isn’t limited to happiness. The city also ranked as the second least stressed U.S. city in 2026, pointing to consistently strong conditions for residents’ overall quality of life.
2. Madison, WI
Madison comes in as the second happiest city in the U.S. in 2026. Home to the University of Wisconsin and surrounded by lakes, the city pairs easy access to the outdoors with strong results across several measures of well-being. About 30.5% of adults experience loneliness, while residents work an average of just 36.3 hours per week. The typical commute is also only 20.7 minutes, giving residents more time back in their day.
3. Boise, ID
Coming in third, Boise stands out for its strong sense of connection and safety. Just 28.9% of adults experience loneliness, the lowest rate among our top 10 cities. Boise also has a low crime rate of 13.88 per 1,000 residents and an average commute of just 20 minutes. These strengths are consistent with our other research. Boise ranked first in our 2025 Best Cities for Working Families study, where it also performed well for affordability and quality of life.
4. Arlington, VA
Few cities in the top 10 pair high incomes with strong mental well-being quite like Arlington. Ranking fourth overall, Arlington has the second-highest median household income in the top 10 at $140,200, while just 13.1% of adults experience frequent mental distress. The city is also one of the easiest to navigate without a car, earning a Walk Score of 71 and Bike Score of 72. Unemployment is low at 2.9%, adding another point of stability for residents.
5. Omaha, NE
Omaha’s fifth-place finish adds to an already strong year for the Nebraska city. Residents have an average commute of just 20 minutes, while median one-bedroom rent is $1,000, the lowest among our 10 happiest cities. About 29.6% of adults experience loneliness, also one of the lowest rates in the top 10. It’s not surprising that Omaha earned the first spot in our 2026 ranking of the least stressed U.S. cities, where its strong job market and relatively affordable cost of living helped set it apart.
6. Seattle, WA
Seattle earns the sixth spot with strong results across mental well-being and access to city amenities. About 29.1% of adults experience loneliness, the second-lowest rate among our top 10 cities. The city also earns a Walk Score of 74 and Bike Score of 71, making it easier to get around without relying on a car. Seattle ranks #6 for its park system too, giving residents plenty of opportunities to spend time outdoors.
7. Fremont, CA
Fremont stands out for having the lowest rate of frequent mental distress among our 10 happiest cities, at just 12.9%. Residents also work an average of only 35 hours per week, more than three hours below the 38.26-hour average across all 100 cities analyzed. Economic stability is another strength. Median household income reaches $181,506, the highest among the top 10, helping Fremont secure the seventh spot overall.
8. Gilbert, AZ
Safety is one of Gilbert’s biggest strengths, helping the Arizona city rank eighth overall. Its annual crime rate is just 10.58 incidents per 1,000 residents, the lowest among our 10 happiest cities. Unemployment is also low at 3%, while median household income is $121,351. Together, those factors point to a community where residents benefit from both economic stability and a strong sense of security.
9. Minneapolis, MN
Minneapolis ranks ninth for happiness and continues to stand out for the quality of life it offers outside of work. The city earned the first spot in our 2026 Best Cities for Work-Life Balance study, with residents working an average of 36.6 hours per week. Minneapolis also earns a Bike Score of 83 and ranks #2 for its park system, giving residents plenty of options for getting outside and around the city.
10. Irvine, CA
Rounding out the top 10, Irvine performs especially well when it comes to safety and access to green space. The Orange County city records just 16.50 crimes per 1,000 residents, one of the lowest rates among our happiest cities, and ranks #4 for its park system. Irvine also has an 8% separation and divorce rate, the second lowest among the top 10. Those strengths help the city score highly for happiness despite having the highest one-bedroom rent in the group at $2,789.
What Are the Unhappiest Cities in the U.S. in 2026?
Not every city performed as strongly in our analysis. Newark, NJ; Nashville, TN; Detroit, MI; Dallas, TX; Jacksonville, FL; Houston, TX; Baltimore, MD; and Birmingham, AL ranked as the unhappiest cities in the U.S. in 2026. That doesn’t mean all residents of these cities have unhappy lives. Instead, the results point to some of the day-to-day conditions that can make it harder to maintain a high quality of life.
Methodology
To calculate our rankings, we created indices across categories tied to employment, finances, mental well-being, and safety. Each category included multiple metrics, which we standardized and combined to calculate each city’s overall score. See each metric and source below.
Income & Employment (35%)
Unemployment Index (10%)
This data was sourced from the U.S. Census Bureau’s most recent ACS dataset.
Hour Commute Index (5%)
This is based on the percentage of workers with a commute longer than 60 minutes. Data comes from the U.S. Census Bureau’s most recent ACS dataset (1 year American Community Survey).
Hours Worked Per Week Index (10%)
This statistic is calculated by the total number of workers in the labor force who were unemployed, divided by the total labor force in each city. Data comes from the U.S. Census Bureau’s most recent ACS dataset (1 year American Community Survey).
Rental Housing Affordability Index (10%)
This index was calculated by dividing each city’s annual median rental costs by its annual median household income to reflect what percentage housing costs are relative to local earnings. Rental costs were gathered from Zumper in September 2026.
Emotional & Social Wellbeing (35%)
Separation & Divorce Index (5%)
This is based on the percentage of males and females separated and divorced. Data comes from the U.S. Census Bureau’s most recent ACS dataset (5 year estimates).
Mental Distress Index (10%)
This is based on the age-adjusted percentage of adults who experience frequent mental distress, defined as reporting that their mental health was not good for 14 or more days during the past 30 days. Data was sourced from the most recent CDC PLACES data.
Loneliness Index (10%)
This is based on the age-adjusted percentage of adults who experience feelings of loneliness. Data was sourced from the most recent CDC PLACES data.
Work Life Balance Index (10%)
This index was calculated from a previous Elevate Leadership data study, The Best Cities for Work-Life Balance in 2026, we conducted in January 2026.
Community & Environment (30%)
Crime Rate Index (15%)
This is based on the number of violent and property crimes committed per 1,000 residents by city. Data was sourced from Neighborhood Scout in September 2026.
Walk Index (5%) & Bike Index (5%)
To gauge both the walkability and bike friendliness of each city, Walkscore data was gathered in September 2026.
Greenspace Index (5%)
Trust for Public Land’s city ParkScore ratings were measured across 5 categories: acreage, investment, amenities, access, and equity.
Full Dataset


